
- Bitcoin rebounded to $80,300 after dropping near $79,200, but remains below its key four-hour moving averages.
- The RSI stands near 42, while resistance sits around $80,600 and $81,150. A break below $79,400 could expose BTC to further losses.
Bitcoin recovered toward $80,300 on Monday after falling below the $80K level, but its four-hour chart continues to show signs of weakness. The rebound follows several sessions of selling that pushed BTC down from above $84,000 last week.
At the time of writing, the Binance four-hour chart shows BTC/USDT was trading at $80,303.61. The price had climbed from a recent low near $79,200, although it remained below both the nine-period and 21-period moving averages. Broader market data also placed Bitcoin near $80,400 on Oct 26, with an intraday range of approximately $79,278 to $80,839.
BTC Faces Resistance as Momentum Remains Weak
The chart shows that Bitcoin’s recent decline accelerated after the price reached approximately $84,800. A series of red candles then pushed BTC toward $79,200, with sellers maintaining pressure during the move lower. The latest green candles indicate a recovery attempt, but the price has yet to establish a clear upward trend.
The moving averages remain an important hurdle. The chart places the nine-period average near $80,585 and the 21-period average around $81,152. Bitcoin is trading below both levels, suggesting that short-term momentum remains under pressure. A move above $80,600 could provide the first sign of improvement, while a sustained recovery above $81,150 would offer stronger evidence that buyers are regaining control.
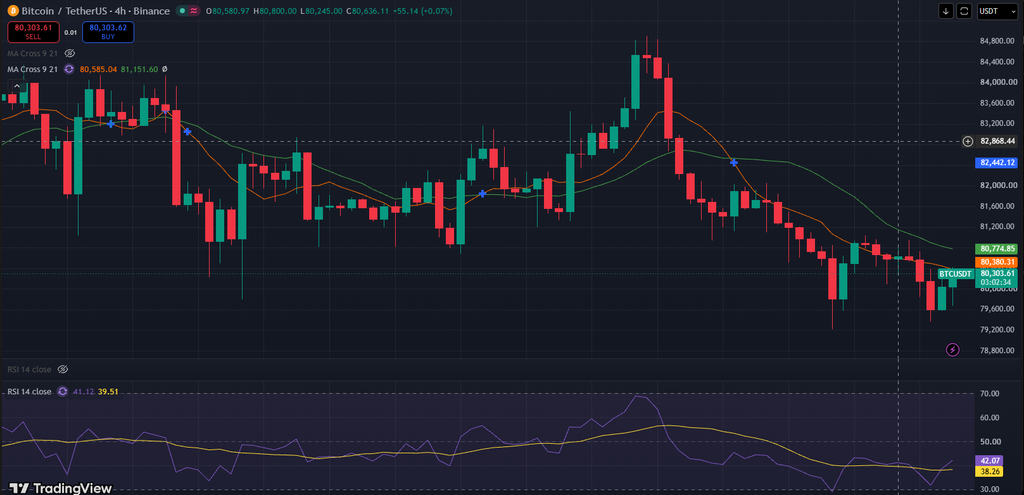
The Relative Strength Index (RSI) reads approximately 42 on the chart. This is below the neutral 50 mark, indicating that bearish momentum still has the advantage. Still, the RSI is above the typical oversold threshold of 30, so the indicator does not yet signal that a strong rebound is inevitable.
On the downside, the area around $79,400 is the first level to watch. A clear break below it could expose the $79,000 region and potentially lower levels. If buyers defend this support and BTC moves above $80,600, the next test would be the $81,150-$81,200 zones.
For now, Bitcoin is attempting to stabilize near $80,000, but the chart does not yet confirm a trend reversal. Its next move will depend on whether buyers can reclaim the moving averages or sellers push the price below recent support.