
Copper prices have been on selling pressure in recent sessions as profit-taking influences momentum. While the bulls are still in control, choppy trading is expected in the near term. Indeed, key technical indicators substantiate this thesis.
In addition to profit-taking, a strong US dollar and tight supply outlook are key drivers. With these differing factors, strong resistance and a steady support will likely fuel sideways trading a investors await a fresh catalyst. At the time of writing, Comex copper price was at $6.61 a pound.
Copper price tests months-long trendline amid strong US dollar
Copper price has moved away from the recent record high, even as the bulls remain in control. At the start of the new week, the negative momentum pushed the red metal below the months-long bullish trendline and short-term moving average.
In addition to the profit-taking, a stronger US dollar is weighing on the metal. Late last week, the dollar index extended its gains to trade at a two-year high at $101.41. While it has eased slightly, it continues to trade above the steady support level of $101. At the time of writing, it was trading at $101.14. A stronger greenback renders copper and other dollar-priced assets more expensive for buyers holding foreign currencies, thus dampening demand.
Meanwhile, concerns over tight supply continue to support copper price. To begin with, copper scrap supply at a global level remains significantly tight amid low mine outputs and regulatory policy shifts. At the same time, analysts expect China’s refined copper output for 2026 to grow at its slowest pace since 2000.
Decline in scrap copper supply is set to fuel a sharp drop in growth in Q4’26. This is expected to offer strong support to copper price, with some analysts projecting an average price of $14,500 a tonne in Q4.
Copper price technical analysis
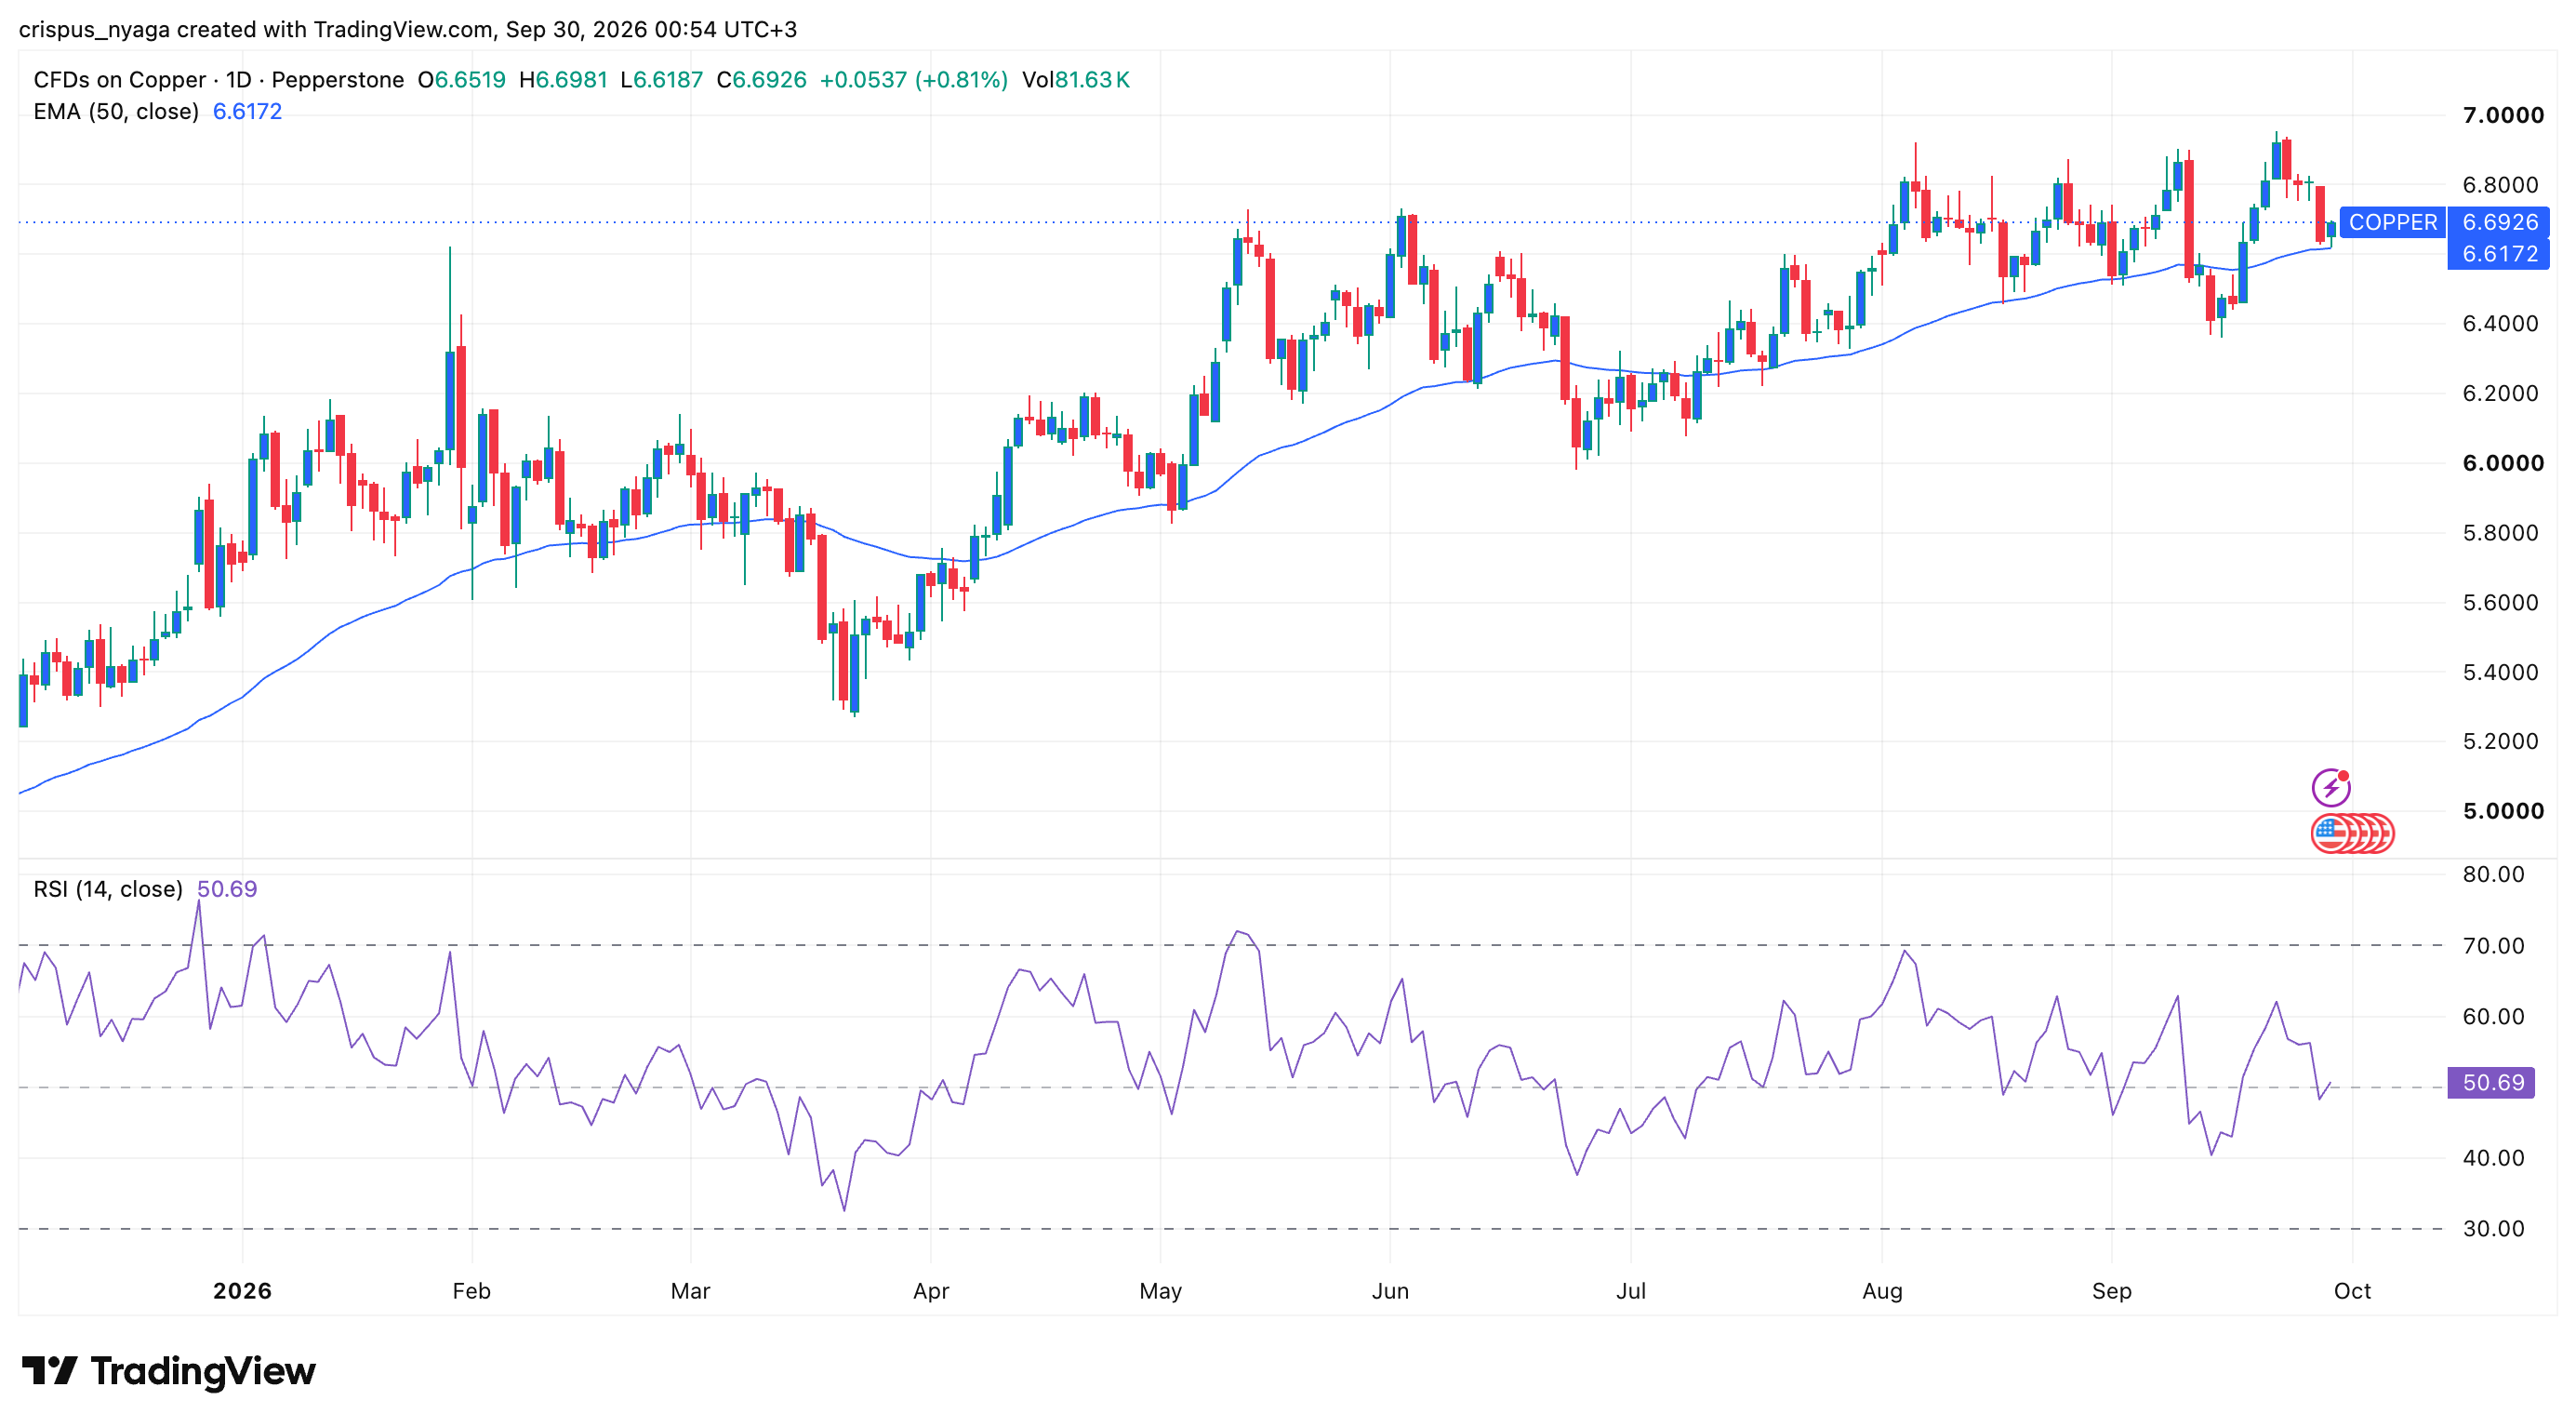
Copper price chart | Source: TradingView
About a week ago, Comex copper futures hit a fresh all-time high after being in the green for six consecutive sessions. While the bulls are still in control, it has erased gains accrued for more than a week. On Monday, it dropped to its lowest level since 17th September.
As seen on its daily chart, the decline has pushed copper price below the months-long trendline that has offered steady support in recent weeks. Besides, it is trading below the short-term 25-day EMA as the bulls strive to defend the support along the medium-term 50-day EMA.
The technical indicators point to a choppy market in the near term. Indeed, the relative strength index substantiates this thesis. At the time of writing, the RSI was at 47 and pointing downwards.
In line with these technical indicators, and the fundamentals, the range between the 50-day EMA at $6.57 and the resistance at $6.80 is worth watching. Further rebounding may be curbed at $6.84. On the flip side, further losses may have the bears test the lower level of $6.54. Below this zone, this thesis will be invalid.
The post Copper price analysis: forecast as rally loses momentum ahead of key events appeared first on Invezz